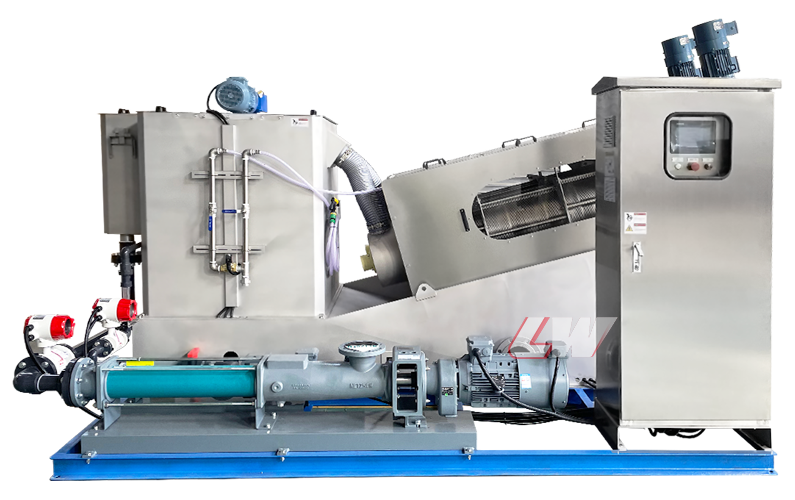
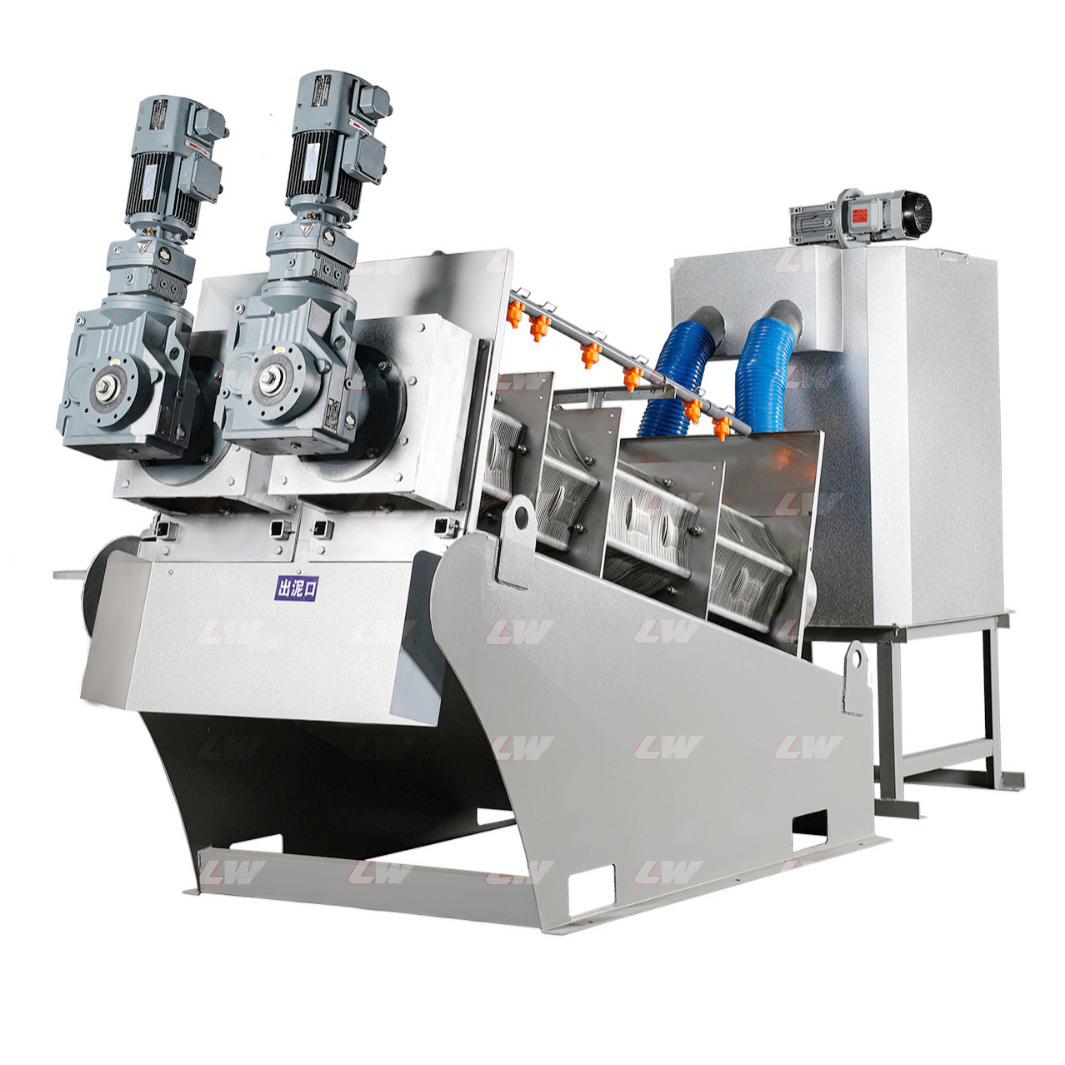
Multi Disc Screw Press with Automatic Cleaning for Organic Wastewater Loway Equipment

Why Correct Sizing Matters

Screw press sludge dewatering machines have become a standard choice across municipal wastewater plants, industrial facilities, chemical processing, and food production — valued for continuous operation, low energy consumption, and minimal clogging compared to older dewatering technologies. But getting the model size right is often harder than it looks, and the stakes are real. Choose a unit that’s too large, and you’re paying for equipment, floor space, and energy you don’t need. Choose one that’s too small, and the plant faces sludge backup, poor cake dryness, and equipment running under constant overload.

In practice, most buyers rely entirely on the supplier’s recommendation. That works fine much of the time, but it also means less visibility into how the numbers were calculated — and more room for mismatched proposals or inflated quotes.

This guide walks through the actual calculation method: how to size a screw press based on daily sludge volume, operating hours, and sludge type, so you can cross-check any vendor proposal or narrow down your own shortlist before requesting quotes.

Key Terms & Two Core Selection Parameters

Before comparing models, it helps to get two terms straight — they show up in almost every spec sheet and vendor conversation, and mixing them up is a common source of sizing errors.

Dry solids capacity is the machine’s core rated parameter — the weight of pure dry solids (not the wet sludge volume) it can process per unit of time. This is what manufacturers use to grade and differentiate models, and it sets the upper limit on processing load.

Wet sludge feed rate is the actual volume of sludge, water content included, generated on site. This is the number you can measure directly at the plant, and it’s your starting point for any sizing calculation.

With those defined, two parameters actually drive model selection:

  1. Average daily sludge volume — sets the machine’s baseline operating load.
  2. Sludge characteristics — sludge type and concentration together determine how difficult the sludge is to dewater, and this is usually where selection differs most from one project to the next. Common sludge types include excess municipal sludge, raw water sludge, chemical coagulation sludge, DAF scum, and mixed industrial sludge.

Get these two right, and the rest of the sizing process is mostly arithmetic.

How to Calculate Hourly Processing Capacity

The first step in sizing is converting your daily sludge volume into an hourly figure — since that’s the unit most spec sheets are built around.

Formula: Hourly processing capacity (m³/h) = Daily sludge volume (m³/d) ÷ Actual operating hours (h)

Most plants run their screw press continuously, 24 hours a day. Under that assumption, a project generating 100 m³ of sludge per day works out to roughly 4 m³/h. That figure is used as the reference load throughout the model comparisons below.

If your operation only runs the machine during daytime shifts rather than around the clock, the same daily volume gets compressed into fewer hours — which pushes the hourly load higher. In that case, it’s worth sizing up slightly to avoid sludge piling up during peak periods.

Model Selection by Sludge Type

Loway screw press model

Model

DS Standard – Low Concentration (kg/h)

DS Standard – High Concentration (kg/h)

Sludge Flow Rate -2000mg/L (m³/h)

Sludge Flow Rate – 5000mg/L (m³/h)

Sludge Flow Rate – 10000mg/L (m³/h)

Sludge Flow Rate – 20000mg/L (m³/h)

Sludge Flow Rate – 25000mg/L (m³/h)

Sludge Flow Rate – 50000mg/L (m³/h)

LWDL101

3

5

~ 2.5

~ 1.0

~ 0.5

~0.25

~ 0.2

~ 0.1

LWDL131

5

10

~ 3.5

~ 1.4

~ 1

~0.5

~ 0.4

~ 0.2

LWDL132

15

20

~ 7.5

~ 3

~ 2

~1

~ 0.8

~ 0.4

LWDL251

15

30

~ 10

~ 4

~ 3

~1.5

~ 1.2

~ 0.6

LWDL201

9

15

~ 6

~ 3

~ 2

~ 1

~ 0.8

~ 0.4

LWDL202

18

30

~ 12.5

~ 5.7

~ 4

~ 2

~ 1.6

~ 0.8

LWDL252

30

60

~ 19

~ 7.6

~ 6

~3

~ 2.4

~ 1.2

LWDL301

30

60

~ 20

~ 8

~ 6

~2.5

~ 2.4

~ 1.2

LWDL302

60

120

~ 37.5

~ 15

~ 12

~5

~ 4.8

~ 2.4

LWDL303

115

175

~ 57.5

~ 23

~ 17.5

~7.5

~ 7

~ 3.5

LWDL304

150

230

~ 75

~ 30

~ 23

~10

~ 9.2

~ 4.6

LWDL351

50

100

~ 32.5

~ 13

~ 10

~5

~ 4

~ 2

LWDL352

125

200

~ 62.5

~ 25

~ 20

~10

~ 8

~ 4

LWDL353

185

300

~ 92.5

~ 37

~ 30

~15

~ 12

~ 6

LWDL354

250

400

~ 125

~ 50

~ 40

~20

~ 16

~ 8

LWDL401

80

155

~ 47.5

~ 19

~ 15.5

~6.5

~ 6.2

~ 3.1

LWDL402

160

310

~ 92.5

~ 37

~ 31

~13

~ 12.4

~ 6.2

LWDL403

285

455

~ 142.5

~ 57

~ 45.5

~19.5

~ 18.2

~ 9.1

LWDL404

365

610

~ 182.5

~ 73

~ 61

~26

~ 24.4

~ 12.2

Processing volume alone doesn’t determine the right model — sludge type and concentration matter just as much. Viscosity, solids content, and dewatering resistance vary considerably between sludge types, and two projects with the same daily volume can need different equipment entirely.

The table below uses a 4 m³/h hourly load as the reference point (based on the 100 m³/day, 24-hour operation example above) and shows how model recommendations shift by sludge type.

Sludge Type

Concentration

Recommended Model

Notes

Low-concentration general sludge (raw water sludge, excess municipal sludge, general chemical sludge)

~0.2%

Model 132 (basic) / Model 201 (recommended)

Low viscosity, good flowability, low dewatering resistance. Model 201 offers a better balance of stability and cost for standard projects.

Medium-concentration general sludge (biological excess sludge, chemical coagulation sludge)

~1.0%

Model 301 (basic) / Model 302 (with fluctuation)

Higher dry solids ratio than low-concentration sludge. Use Model 302 if feed volume or water quality varies, to build in extra margin.

DAF scum / oily sludge

Model 302

High oil and grease content and viscosity increase risk of clogging around the shaft and discs. Downsizing is not recommended at this load level.

High-concentration mixed sludge (multi-process industrial wastewater, combined treatment plants)

~3.0%

Model 301

Matches rated capacity closely at this load — minimal excess capacity, no overload risk.

Note: The models referenced here (132/201/301/302) are illustrative model designations used in this sizing methodology. Actual model availability may vary — contact our team to confirm current specifications.

Sizing for Non-Standard Conditions

The reference loads above are useful benchmarks, but most real-world projects don’t line up exactly with a fixed 4 m³/h scenario. Here’s how to adapt the same method to your actual site conditions:

  1. Calculate your actual hourly feed rate — start with your measured daily sludge volume and actual operating hours (not the standard 24-hour assumption unless that’s genuinely how your plant runs).
  2. Confirm sludge concentration and type through on-site testing — this determines how difficult the sludge is to dewater.
  3. Match against the reference table above to get an initial model recommendation.
  4. Build in a capacity margin based on how stable your operating conditions are.

On margin specifically: for stable operations with consistent water quality and volume, a 10% margin is usually sufficient. For sites with fluctuating water quality, inconsistent volume, or sludge with higher oil/solids content, a 15-20% margin gives more reliable long-term performance.

For unusual conditions — high salinity, high viscosity, high solids content — there’s no standardized sizing formula. The practical approach is to propose an initial model based on the closest matching profile, then request a bench-scale dewatering trial to confirm or adjust the selection before finalizing.

Common Sizing Mistakes to Avoid

A few patterns show up repeatedly in sizing decisions that don’t hold up over time:

Undersizing to cut upfront cost. A machine running consistently at or above its rated load will wear faster, need more maintenance, and cost more over its lifespan than the initial savings are worth.

Oversizing “just in case.” Extra capacity means extra capital cost, more floor space, and higher energy use — without a corresponding operational benefit if the load never actually reaches that level.

Downsizing for oily or high-viscosity sludge. DAF scum, oily sludge, and high-viscosity sludge are harder to dewater than standard biological sludge, even at the same volume. Applying standard sizing logic to these sludge types — and picking a smaller model to save cost — is one of the more common causes of clogging and underperformance in the field.

Sizing off volume alone. The most reliable order of evaluation is: sludge type and concentration first, hourly processing load second, capacity margin last. Skipping straight to “how many cubic meters per day” without accounting for sludge characteristics tends to produce a mismatch.

Where a project is complex enough — unusual sludge composition, fluctuating input, or a use case with limited track record — it’s worth pairing your own initial sizing with a supplier’s technical review and, if possible, a small-scale trial before committing to a model.

Get Your Sizing Confirmed by Our Team

The calculations above will get you a solid starting point — enough to evaluate vendor proposals or narrow your shortlist with confidence. For projects with variable sludge composition, high oil content, or non-standard operating schedules, our engineering team can review your sludge data and, where needed, run a bench-scale trial to confirm the right model before you commit.

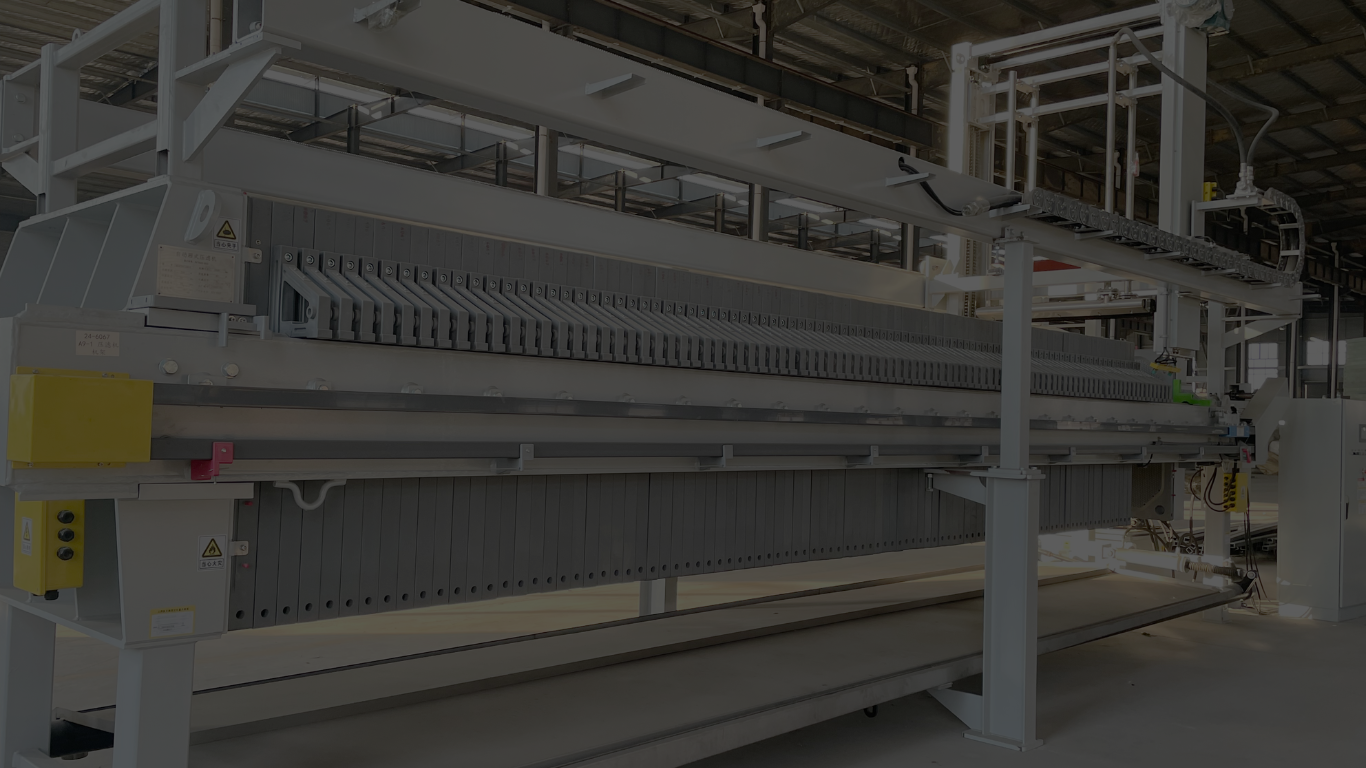
Automatic washing filter press equipment for solid liquid separation Industry application Loway factory China

Ready to Optimize Your Filtration Process?
Contact our team of filtration specialists today to discuss how our filter press solutions can address your specific solid-liquid separation challenges. From process assessment to custom configurations, we’re here to help you achieve maximum efficiency and product quality.

Need filter press proposal

schedule a consultation with our filtration experts

Contact Information